

A floating rate portfolio that seeks to deliver attractive income1
View the Fund’s Latest Performance
Why Blackstone Floating Rate Enhanced Income Fund?
An income-oriented strategy targeting floating rate senior loans.

Bringing Blackstone’s leading institutional credit platform to individual investors
Income Generation
The Fund seeks to provide attractive income primarily from floating rate senior loans
Institutional Platform
The Fund provides individual investors access to Blackstone’s leading institutional credit platform, which has significant scale and experience in the credit markets
Potentially Lower Volatility
The Fund will seek to provide exposure to the floating rate senior loan market with less price volatility than comparable listed closed-end vehicles
Efficient Structure
An interval fund structure reduces the need to hold cash and permits the use of leverage to potentially enhance yield
Portfolio Diversification
Because floating rate senior loans have low correlation to traditional fixed income investments, we believe the Fund can help diversify a client’s existing bond portfolio
Note: For data on the low correlation of loans to traditional fixed income investments, see Why Floating Rate Senior Loans below. Data provided is for informational use only. Indices are unmanaged, do not reflect the deduction of fees and expenses, and are not available for direct investment. Fees and expenses will be deducted from any investment in the Fund. The performance of the Fund will differ and may vary materially from any index. An investment in the Fund is different from a direct investment in any of the asset classes discussed in this brochure. Performance data quoted represents past performance for the asset class shown, which is no guarantee of future results.
We hope to achieve lower price volatility through the use of an “interval fund” structure. Interval funds do not trade on a secondary market and are offered for sale and repurchase at net asset value (“NAV”). The value of underlying investments may fluctuate and shares may be worth less than the original amount invested. There can be no assurance that the Fund will achieve its investment objective or avoid losses. Interval funds are closed-end funds but are different from listed closed-end funds in that their shares do not trade on the secondary market. Instead, interval fund shares are subject to periodic repurchase offers by the fund at a price based on NAV. Interval funds are also permitted to continuously offer their shares at a price based on NAV.
The Fund anticipates utilizing leverage in an amount not to exceed 33 1⁄3% of Managed Assets at the time the leverage is incurred in order to buy additional securities. “Managed Assets” means net assets plus the amount of any Borrowings and the liquidation preference of any Preferred Shares that may be outstanding. Leverage may result in greater volatility of the net asset value and distributions on shares because changes in the value of the Fund’s portfolio investments, including investments purchased with the proceeds from Borrowings, if any, are borne entirely by shareholders. In addition, the Fund’s use of leverage will result in increased operating costs. There can be no assurance that the Fund’s leveraging strategy will be successful. For more information please see the Important Disclosure Information section of this brochure.
Class I Summary as of 3/31/2024 (Net of Fees)
Fund Facts
| Ticker | BGFLX |
| Annualized Distribution Rate2 | 11.29% |
| NAV/Share | $22.15 |
| Inception | 1/18/2018 |
Fund Expenses
| Management Fees+ | 1.00% |
| Gross Expense Ratio^+ | 4.44% |
| Net Expense Ratio^+ | 4.13% |
| Adjusted Expense Ratio^+ | 1.50% |
| Sales Load* | None |
Total Returns (Net of Fees)
| Monthly | 3-Month | 6-Month | YTD | 1-Year | 3-Year | 5-Year | ITD | |
|---|---|---|---|---|---|---|---|---|
| Class I | 1.50% | 3.50% | 7.27% | 3.50% | 16.50% | 5.45% | 5.64% | 5.19% |
| Morningstar LSTA US Leveraged Loan Index3 | 0.85% | 2.46% | 5.40% | 2.46% | 12.47% | 5.99% | 5.47% | 5.04% |
Note: Past performance is historical and not a guarantee of future results. ITD returns are annualized and based on the I Share inception date of 1/18/2018.
Data is as of 3/31/2024, unless otherwise indicated. Returns for periods greater than one year are annualized. Financial data is estimated and unaudited. Past performance is historical and not a guarantee of future results.
Class T Summary as of 3/31/2024 (Net of Fees)
Fund Facts
| Ticker | BGFTX |
| Annualized Distribution Rate2 | 10.79% |
| NAV/Share | $22.11 |
| Inception | 5/7/2018 |
Fund Expenses
| Management Fees+ | 1.00% |
| Service Fees | 0.25% |
| Distribution Fees | 0.25% |
| Gross Expense Ratio^+ | 4.94% |
| Net Expense Ratio^+ | 4.63% |
| Adjusted Expense Ratio^+ | 2.00% |
| Sales Load* | Up to 2.5% |
Total Returns (Net of Fees)
| Monthly | 3-Month | 6-Month | YTD | 1-Year | 3-Year | 5-Year | ITD | |
|---|---|---|---|---|---|---|---|---|
| Class T (no Sales Load) | 1.46% | 3.37% | 7.00% | 3.37% | 15.92% | 4.91% | 5.12% | 4.70% |
| Class T (with Sales Load)* | -1.06% | 0.80% | 4.31% | 0.80% | 13.02% | 4.04% | 4.59% | 4.25% |
| Morningstar LSTA US Leveraged Loan Index3 | 0.85% | 2.46% | 5.40% | 2.46% | 12.47% | 5.99% | 5.47% | 4.99% |
Note: Past performance is historical and not a guarantee of future results. ITD returns are annualized and based on the T Share inception date of 5/7/2018.
*Assumes payment of the full front-end 2.5% sales load at initial subscription.
Data is as of 3/31/2024, unless otherwise indicated. Returns for periods greater than one year are annualized. Financial data is estimated and unaudited. Past performance is historical and not a guarantee of future results.
Class D Summary as of 3/31/2024 (Net of Fees)
Fund Facts
| Ticker | BGFDX |
| Annualized Distribution Rate2 | 10.08% |
| NAV/Share | $22.17 |
| Inception | 9/28/2018 |
Fund Expenses
| Management Fees+ | 1.00% |
| Service Fees | 0.25% |
| Gross Expense Ratio^+ | 8.42% |
| Net Expense Ratio^+ | 4.38% |
| Adjusted Expense Ratio^+ | 1.75% |
| Sales Load* | None |
Total Returns (Net of Fees)
| Monthly | 3-Month | 6-Month | YTD | 1-Year | 3-Year | 5-Year | ITD | |
|---|---|---|---|---|---|---|---|---|
| Class D | 1.44% | 3.43% | 7.08% | 3.43% | 16.14% | 5.15% | 5.39% | 4.94% |
| Morningstar LSTA US Leveraged Loan Index3 | 0.85% | 2.46% | 5.40% | 2.46% | 12.47% | 5.99% | 5.47% | 4.96% |
Note: Past performance is historical and not a guarantee of future results. ITD returns are annualized and based on the D Share inception date of 9/28/2018.
Data is as of 3/31/2024, unless otherwise indicated. Returns for periods greater than one year are annualized. Financial data is estimated and unaudited. Past performance is historical and not a guarantee of future results.
Class T-I Summary as of 3/31/2024 (Net of Fees)
Fund Facts
| Ticker | BGFPX |
| Annualized Distribution Rate2 | 10.78% |
| NAV/Share | $22.65 |
| Inception | 4/18/2019 |
Fund Expenses
| Management Fees+ | 1.00% |
| Service Fees | 0.25% |
| Distribution Fees | 0.25% |
| Gross Expense Ratio^+ | 5.03% |
| Net Expense Ratio^+ | 4.63% |
| Adjusted Expense Ratio^+ | 2.00% |
| Sales Load* | Up to 3.5% |
Total Returns (Net of Fees)
| Monthly | 3-Month | 6-Month | YTD | 1-Year | 3-Year | ITD | |
|---|---|---|---|---|---|---|---|
| Class T-I (no Sales Load) | 1.45% | 3.35% | 7.00% | 3.35% | 15.88% | 4.91% | 4.89% |
| Class T-I (with Sales Load)* | -2.11% | -0.25% | 3.24% | -0.25% | 11.83% | 3.67% | 4.14% |
| Morningstar LSTA US Leveraged Loan Index3 | 0.85% | 2.46% | 5.40% | 2.46% | 12.47% | 5.99% | 5.18% |
Note: Past performance is historical and not a guarantee of future results. ITD returns are annualized and based on the T-I Share inception date of 4/18/2019.
*Assumes payment of the full front-end 3.5% sales load at initial subscription.
Data is as of 3/31/2024, unless otherwise indicated. Returns for periods greater than one year are annualized. Financial data is estimated and unaudited. Past performance is historical and not a guarantee of future results.
Class U Summary as of 3/31/2024 (Net of Fees)
Fund Facts
| Ticker | BGFVX |
| Annualized Distribution Rate2 | 10.79% |
| NAV/Share | $23.08 |
| Inception | 11/27/2019 |
Fund Expenses
| Management Fees+ | 1.00% |
| Service Fees | 0.25% |
| Distribution Fees | 0.25% |
| Gross Expense Ratio^+ | 4.94% |
| Net Expense Ratio^+ | 4.63% |
| Adjusted Expense Ratio^+ | 2.00% |
| Sales Load* | None |
Total Returns (Net of Fees)
| Monthly | 3-Month | 6-Month | YTD | 1-Year | 3-Year | ITD | |
|---|---|---|---|---|---|---|---|
| Class U | 1.44% | 3.38% | 6.96% | 3.38% | 15.87% | 4.90% | 5.14% |
| Morningstar LSTA US Leveraged Loan Index3 | 0.85% | 2.46% | 5.40% | 2.46% | 12.47% | 5.99% | 5.57% |
Note: Past performance is historical and not a guarantee of future results. ITD returns are annualized and based on the U Share inception date of 11/27/2019.
Data is as of 3/31/2024, unless otherwise indicated. Returns for periods greater than one year are annualized. Financial data is estimated and unaudited. Past performance is historical and not a guarantee of future results.
*Class I Shares, Class D, and Class U Shares are each not subject to a sales load; however, investors may be required to pay brokerage commissions on purchases and sales of Class I Shares, Class D Shares, and Class U Shares to their Selling Agent. Investors should consult with their Selling Agent about the sales load and any additional fees or charges their Selling Agent might impose on each class of shares. The actual sales load paid may vary among and within Selling Agents.
+The Fund has agreed to pay the Adviser a management fee at an annual rate equal to 1.00% of the average daily value of the Fund’s net assets. The Adviser voluntarily waived its Management Fee until June 30, 2018. Between July 1, 2018 and March 31, 2019, the Adviser voluntarily waived a portion of its Management Fee and incrementally stepped up the Management Fee towards the full annual rate. Starting April 1, 2019, the Adviser has received a Management Fee at an annual rate of 1.00% of the average daily value of the Fund’s net assets.
^The net expense ratio represents the expense ratio applicable to investors. The gross expense ratio is the total annual fund or class operating expenses directly paid by the fund from the fund’s most recent prospectus (before waivers or reimbursements). The net expense ratio is the total annual fund or class operating expenses directly paid by the fund from the fund’s most recent prospectus, after any fee waiver and/or expense reimbursements that will reduce any fund operating expenses. Blackstone Liquid Credit Strategies LLC has agreed to waive its fees and/or reimburse certain expenses of the Fund to the extent that certain of the Fund’s specified expenses would exceed the total expense cap of 0.50% of the Fund’s net assets (annualized) through January 31, 2024. See the prospectus for estimated interest expenses and additional information regarding fees and estimated operating expenses. The Adjusted Expense Ratio is the same as the Net Expense Ratio but also excludes the estimated interest expense from borrowings incurred directly by the Fund, as outlined in the Prospectus.
Note: Distribution rates are not performance; details regarding distribution rate calculations can be found in the notes at the bottom of this page. The Fund’s distribution rate may be affected by numerous factors, including, but not limited to, changes in realized and projected market returns, Fund performance, and other factors. There can be no assurance that a change in market conditions or other factors will not result in a change in the Fund distribution rate at a future time. Distribution rates may be composed of ordinary income, net capital gains, and/or a return of capital (ROC) of your investment in the fund. Because the distribution rate may include a ROC, it should not be confused with yield or income. In accordance with generally accepted accounting principles (“GAAP”), the Fund estimates that 100% of the distribution referenced herein is attributable to current fiscal year net investment income and the remaining portion (0%) is paid from return of paid-in capital surplus. Final determination of a distribution rate’s tax character will be made on Form 1099 DIV sent to shareholders each January.
Performance is presented from the first business day of the month, the first business day of the year, and the inception date of the class, respectively through 3/31/2024. Net performance is net of share class expenses, including management fees of 1.0% on the Fund’s net assets, less waived expenses. Performance data quoted represents past performance and does not guarantee future results. All ITD statistics above are calculated using daily performance. The investment return and principal value of an investment will fluctuate so that an investor’s shares, when repurchased, may be worth more or less than their original cost and current performance may be lower or higher than the performance data quoted. For more information on these indices please see the Index Definitions section of this website. Indices are unmanaged, do not reflect the deduction of fees and expenses, and are not available for direct investment. The indices presented represent investments that have material differences from an investment in the Fund, including those related to vehicle structure, investment objectives and restrictions, risks, fluctuation of principal, safety guarantees or insurance, fees and expenses, liquidity and tax treatment. Past performance is not necessarily indicative of future results, and there can be no assurance that Blackstone Credit and Insurance will achieve comparable results or that Blackstone Credit and Insurance will be able to implement its investment strategy or achieve its investment objectives. Portfolio diversification does not guarantee profit or protect against loss. For more information please see the Important Disclosure Information section of this website.
The Fund pays the Distributor an ongoing fee (the “Service Fee”) that is calculated monthly and accrued daily at an annualized rate of 0.25% of the Fund’s net assets attributable to Class T, Class T-I, Class D, and Class U Shares. The Service Fee is for personal services provided to shareholders and/or the maintenance of shareholder accounts services and to reimburse the Distributor for related expenses incurred. The Distributor may pay all or a portion of the Service Fee to the Selling Agents that sell Class T, Class T-I, and Class U Shares. In addition, the Fund pays the Distributor an ongoing distribution fee (the “Distribution Fee”) that is calculated monthly and accrued daily at an annualized rate of 0.25% of the Fund’s net assets attributable to Class T, Class T-I, and Class U Shares. The Distribution Fee is for the sale and marketing of the Class T, Class T-I, and Class U Shares and to reimburse the Distributor for related expenses incurred. The Distributor may pay all or a portion of the Distribution Fee to the Selling Agents that sell Class T, Class T-I, and Class U Shares. Class I Shares do not incur a Service Fee or a Distribution Fee.
The public offering price an investor pays when buying Class T and Class T-I Shares of the Fund is the NAV of the shares at the time of purchase, plus an initial sales load. The initial sales load varies depending on the size of an investor’s purchase. The actual sales load paid may vary among and within Selling Agents. No sales load is imposed when Class T and Class T-I Shares are issued pursuant to the automatic reinvestment of income dividends or capital gains distributions. It is the responsibility of the investor and/or the investor’s financial intermediary to ensure that the investor obtains the proper breakpoint sales load discount, if any.
Why Blackstone Credit and Insurance?4
Blackstone is one of the leading alternative investment firms.
Our credit business is one of the world’s largest credit managers.
Focused primarily on below-investment grade corporate credit
$330B
assets under management
25+
years of experience
627
professionals around the globe
Why Floating Rate Senior Loans?
Seniority in Capital Structure
Floating rate senior loans are generally defensive as they occupy
the senior-most position in a company’s capital structure.
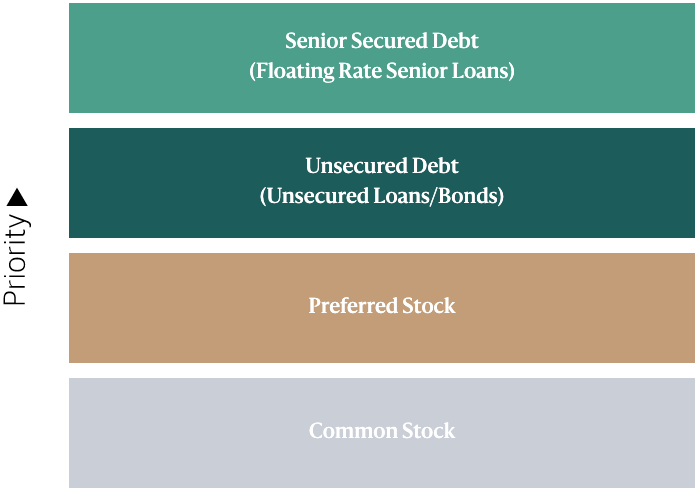
- Senior loans (also referred to as Leveraged Loans or Bank Loans) are so named because they sit at the top of a company’s capital structure
- Senior loans are typically secured by company assets such as property, plant, equipment, or other collateral
- In the event of a default, investors in a company’s senior loans may be the first to be repaid, and would recover more of their investment than debt and equity holders lower in the capital structure
Note: There is no assurance that the liquidation of any collateral from a senior loan would satisfy the borrower’s obligation, or that such collateral could be liquidated.
Why Interval Funds?
Literature and Fund Documents
What Are the Risks
Floating rate senior loans are rated below investment grade. What does that mean for investors?
Senior loans are rated below-investment grade—just like their sister market, high yield bonds. Due to higher leverage and other factors, non-investment-grade debt has a greater risk of default than the so-called high grade markets. Investors typically are Compensated for this higher risk with higher yields. These types of loans are typically made to companies with ratings below investment grade, so the level of credit risk (i.e., the degree to which changes in the issuers’ financial condition will affect bond prices) is comparatively high. It’s important to keep in mind that valuations in this market segment can change quickly. In other words, just because the bonds are “senior” doesn’t mean that they aren’t volatile.
Is the senior loan market liquid?
In aggregate, the senior loan market is quite liquid although it faced the same liquidity challenges witnessed by all debt markets during the 2007/2008 financial crisis. Within the sector itself, larger issues tend to be more liquid than smaller, and the loans of well-known companies may be a better bid than those of the more esoteric. Liquidity may also be impacted for issues that are facing credit stress which, in some cases, may provide the opportunity for bottom-up managers to purchase loans at a deep discount to their intrinsic value.
What might happen to senior loans in a recession?
Like corporate bonds, senior loans are subject to the credit risk of the indebted company and economic slowdowns may put pressure on corporate cash flows and/or profitability. Declining cash flows may reduce the ability of a company to service its debt and, incidentally, may push its market price lower. The lower credit ratings of senior loans by that senior loans are more highly leveraged than their investment-grade counterparts or may provide lower recovery rates in the event of a default. This means they may be more vulnerable in a recession, however, managers may seek to mitigate the credit risk associated with below investment-grade debt by careful credit analysis of the borrower and an assessment of the collateral attached to the loan. Although our investment process is bottom-up (focusing on the fundamental risk characteristics of a single issuer), we are influenced by developments in the broader economic and credit cycles that might impact specific industries or the senior loan market in general. The nationally recognized statistical rating organizations (NRSROs) relative to investment grade debt may indicate that senior loans are more highly leveraged than their investment-grade counterparts or may provide lower recovery rates in the event of a default. This means they may be more vulnerable in a recession, however, managers may seek to mitigate the credit risk associated with below investment-grade debt by careful credit analysis of the borrower and an assessment of the collateral attached to the loan. Although our investment process is bottom-up (focusing on the fundamental risk characteristics of a single issuer), we are influenced by developments in the broader economic and credit cycles that might impact specific industries or the senior loan market in general.
What are default rates and why are they important for senior loans?
A default occurs when a borrower fails to make timely principal or interest payments. All defaults in the asset class may be totaled up as a percent of the entire market for any given period of time; this results in a default rate. Default rates are often cited in the financial press as one measure of creditworthiness for the senior loan market broadly. Default rates can be measured on a historical basis, or default rates may be forecasted.
Additional Risks & Important Disclosures
There can be no assurance that the Fund will achieve its investment objectives.
Investment Strategies: Under normal market conditions, the Fund will invest at least 80% of its Managed Assets (as defined below) in floating rate instruments. Under current market conditions, the Fund anticipates that its portfolio of floating rate instruments will primarily consist of floating rate loans. In addition, the Fund may invest up to 20% of its Managed Assets in each of: (i) structured products (including, without limitation, the rated debt tranches of collateralized loan obligations (“CLOs”), floating rate mortgage-backed securities and credit linked notes), (ii) derivatives, including credit derivatives, (iii) warrants and equity securities that are incidental to the Fund’s purchase of floating rate instruments or in connection with a reorganization of a Borrower or issuer and (iv) fixed rate instruments (including, without limitation, high yield corporate debt securities, or bonds, or U.S. government debt securities). To the extent that a structured product or a security underlying a derivative is, or is composed of, a floating rate instrument, the Fund will include it for the purposes of the Fund’s 80% policy.
The Fund may invest in securities of any credit quality, maturity and duration. The Fund may invest in U.S. dollar and non-U.S. dollar denominated securities of issuers located anywhere in the world, and of issuers that operate in any industry. In pursuing the Fund’s investment objective, the Adviser will seek to enhance the Fund’s return by the use of leverage.
Investment and Market Risk. An investment in the Fund’s Common Shares is subject to investment risk, including the possible loss of the entire principal amount invested. An investment in the Fund’s Common Shares represents an indirect investment in the portfolio of floating rate instruments, other securities and derivative investments owned by the Fund, and the value of these investments may fluctuate, sometimes rapidly and unpredictably. At any point in time an investment in the Fund’s Common Shares may be worth less than the original amount invested, even after taking into account distributions paid by the Fund and the ability of shareholders to reinvest dividends. The Fund may also use leverage, which would magnify the Fund’s investment, market and certain other risks.
Common Shares Liquidity Risk An investment in the Fund is suitable only for long-term investors who can bear the risks associated with the limited liquidity of the Common Shares. The Fund is a diversified, closed-end management investment company that continuously offers its Common Shares and is operated as an “interval fund”. In order to provide liquidity to shareholders, the Fund, subject to applicable law, will conduct repurchase offers of the Fund’s outstanding Common Shares at NAV, subject to approval of the Board. The Fund will provide notification of each repurchase offer at least 7 calendar days before the repurchase request deadline. The Fund may impose a repurchase fee of up to 2% on Common Shares that are accepted for repurchase by the Fund and have been held by an investor for less than one year.
Repurchase Program Risk The Fund believes that these repurchase offers are generally beneficial to the Fund’s shareholders, and repurchases generally will be funded from available cash, cash from the sale of Common Shares or sales of portfolio securities. However, repurchase offers and the need to fund repurchase obligations may affect the ability of the Fund to be fully invested or force the Fund to maintain a higher percentage of its assets in liquid investments, which may harm the Fund’s investment performance. Moreover, diminution in the size of the Fund through repurchases may result in untimely sales of portfolio securities (with associated imputed transaction costs, which may be significant), and may limit the ability of the Fund to participate in new investment opportunities or to achieve its investment objective. The Fund may accumulate cash by holding back (i.e., not reinvesting) payments received in connection with the Fund’s investments and cash from the sale of Common Shares. The Fund believes that it can meet the maximum potential amount of the Fund’s repurchase obligations. If at any time cash and other liquid assets held by the Fund are not sufficient to meet the Fund’s repurchase obligations, the Fund intends, if necessary, to sell investments. In addition, if the Fund borrows to finance repurchases, interest on that borrowing will negatively affect Common Shareholders who do not tender their Common Shares by increasing the Fund’s expenses and reducing any net investment income.
If a repurchase offer is oversubscribed, the Fund may determine to increase the amount repurchased by up to 2% of the Fund’s outstanding Common Shares as of the date of the Repurchase Request Deadline. In the event the Fund determines not to repurchase more than the repurchase offer amount, or if shareholders tender more than the repurchase offer amount plus 2% of the Fund’s outstanding Common Shares as of the date of the Repurchase Request Deadline, the Fund will repurchase the Common Shares tendered on a pro rata basis, and shareholders will have to wait until the next repurchase offer to make another repurchase request. As a result, shareholders may be unable to liquidate all or a given percentage of their investment in the Fund during a particular repurchase offer. Some shareholders, in anticipation of proration, may tender more Common Shares than they wish to have repurchased in a particular month, thereby increasing the likelihood that proration will occur. A shareholder may be subject to market and other risks, and the NAV of Common Shares tendered in a repurchase offer may decline between the Repurchase Request Deadline and the date on which the NAV for tendered Common Shares is determined. In addition, the repurchase of Common Shares by the Fund will generally be a taxable event to Common Shareholders.
Loans Risk. Under normal market conditions, the Fund will invest primarily in Loans. The Loans that the Fund may invest primarily in Loans. The Loans that the Fund may invest in include Loans that are first lien, second lien, third lien or that are unsecured. In addition, the Loans the Fund will invest in will usually be rated below investment grade or may also be unrated. Loans are subject to a number of risks described elsewhere in this Prospectus, including credit risk, liquidity risk, below investment grade instruments risk and management risk.
Although certain Loans in which the Fund may invest will be secured by collateral, there can be no assurance that such collateral could be readily liquidated or that the liquidation of such collateral would satisfy the Borrower’s obligation in the event of non-payment of scheduled interest or principal. In the event of the bankruptcy or insolvency of a Borrower, the Fund could experience delays or limitations with respect to its ability to realize the benefits of the collateral securing a Loan. In the event of a decline in the value of the already pledged collateral, if the terms of a Loan do not require the Borrower to pledge additional collateral, the Fund will be exposed to the risk that the value of the collateral will not at all times equal or exceed the amount of the Borrower’s obligations under the Loans. To the extent that a Loan is collateralized by stock in the Borrower or its subsidiaries, such stock may lose some or all of its value in the event of the bankruptcy or insolvency of the Borrower. Those Loans that are under-collateralized involve a greater risk of loss.
In general, the secondary trading market for Loans is not fully-developed. No active trading market may exist for certain Loans, which may make it difficult to value them. Illiquidity and adverse market conditions may mean that the Fund may not be able to sell certain Loans 18 quickly or at a fair price. To the extent that a secondary market does exist for certain Loans, the market for them may be subject to irregular trading activity, wide bid/ask spreads and extended trade settlement periods.
Below Investment Grade, or High Yield, Instruments Risk. The Fund anticipates that it may invest substantially all of its assets in instruments that are rated below investment grade. Below investment grade instruments are commonly referred to as “junk” or high-yield instruments and are regarded as predominantly speculative with respect to the issuer’s capacity to pay interest and repay principal. Lower grade instruments may be particularly susceptible to economic downturns, which could adversely affect the ability of the issuers of such instruments to repay principal and pay interest thereon, increase the incidence of default for such instruments and severely disrupt the market value of such instruments.
Leverage Risk. Under current market conditions, the Fund generally intends to utilize leverage in an amount up to 33 1/3% of the Fund’s Managed Assets principally through Borrowings. In the future, the Fund may elect to utilize leverage in an amount up to 50% of the Fund’s total assets through the issuance of Preferred Shares. Leverage may result in greater volatility of the net asset value and distributions on the Common Shares because changes in the value of the Fund’s portfolio investments, including investments purchased with the proceeds from Borrowings or the issuance of Preferred Shares, if any, are borne entirely by Common Shareholders. Common Share income may fall if the interest rate on Borrowings or the dividend rate on Preferred Shares rises, and may fluctuate as the interest rate on Borrowings or the dividend rate on Preferred Shares varies. In addition, the Fund’s use of leverage will result in increased operating costs. Thus, to the extent that the then-current cost of any leverage, together with other related expenses, approaches the net return on the Fund’s investment portfolio, the benefit of leverage to Common Shareholders will be reduced, and if the then-current cost of any leverage together with related expenses were to exceed the net return on the Fund’s portfolio, the Fund’s leveraged capital structure would result in a lower rate of return to Common Shareholders than if the Fund were not so leveraged. In addition, the costs associated with the Fund’s incursion and maintenance of leverage could increase over time. There can be no assurance that the Fund’s leveraging strategy will be successful.
Any decline in the net asset value of the Fund will be borne entirely by Common Shareholders. Therefore, if the market value of the Fund’s portfolio declines, the Fund’s use of leverage will result in a greater decrease in net asset value to Common Shareholders than if the Fund were not leveraged.
The Fund may also be subject to the following categories of risk: Derivatives Risk, Segregation and Coverage Risk, Counterparty Risk, Derivatives Legislation and Regulatory Risk, Commodities Regulation, Potential Conflicts of Interest Risk, Limitations on Transactions with Affiliates Risk, Dependence on Key Personnel Risk, Prepayment Risk, Inflation/Deflation Risk, Non-U.S. Instruments Risk, Foreign Currency Risk, UK Exist from the European Union, Repurchase Agreements Risk, Reverse Repurchase Agreements Risk, Investments in Equity Securities or Warrants Incidental to Investments in Floating Rate Instrument, Possible U.S. Federal Income Tax Reform, Cyber-Security Risk and Identity Theft Risks, Portfolio Turnover Risk, Non-Diversification Risk and Anti-Takeover Provisions.
Prospective investors should note that certain senior members of the Blackstone LCS team have been working together since 1998 while at other institutions, starting at the IndoSuez Capital Division of Crédit Agricole. These team members moved to Royal Bank of Canada in 2001, joined GSO Capital Partners LP (then “GSO” and now, together with its affiliates in the credit-focused business unit of Blackstone, “Blackstone Credit and Insurance”) in 2005, and joined Blackstone in 2008 in connection with Blackstone’s acquisition of GSO. Certain historical information contained in this material includes references to vehicles and managed accounts managed by members of the Manager’s team while at other institutions indicated above. In March 2008, together with the acquisition of GSO and certain of its affiliates by Blackstone, the legacy collateralized loan obligation business of GSO Debt Funds Management LLC (now known as Blackstone Liquid Credit Strategies LLC) was combined with the legacy collateralized loan obligation business of Blackstone Debt Advisors L.P. Past performance is not an indication of future investment returns, and there can be no assurance that such returns will be achieved.
Please see the Prospectus of the Fund for a full description of the risk factors listed above.
INDEX DEFINITIONS
Floating Rate Loans are represented by the S&P/LSTA Leveraged Loan index, which is a market-value weighted index covering more than 1,100 loan facilities and reflects the performance of the U.S.-denominated institutional leveraged loans. Corp High Yield is represented by the Bloomberg Barclays US Corporate High Yield index, which measures the USD-denominated, high yield, fixed-rate corporate bond market. Securities are classified as high yield if the middle rating of Moody’s, Fitch and S&P is Ba1/BB+/BB+ or below. Bonds from issuers with an emerging markets country of risk, are excluded. Emerging Market Debt is represented by the JPM EMBI Plus TR index, a market capitalization-weighted index based on bonds in emerging markets in external currency denomination across 21 countries. Municipals are represented by the Bloomberg Barclays U.S. Municipal Index, a USD-denominated index that tracks the long-term tax exempt bond market. The index has four main sectors: state and local general obligation bonds, revenue bonds, insured bonds and pre-refunded bonds. Treasuries are represented by the Bloomberg Barclays US Treasury Index, which measures US dollar-denominated, fixed-rate, nominal debt issued by the US Treasury (excluding T-Bills). Mortgages are represented by the Bloomberg Barclays US MBS Index, which tracks agency mortgage backed pass-through securities (both fixed-rate and hybrid ARM) guaranteed by Ginnie Mae (GNMA), Fannie Mae (FNMA), and Freddie Mac (FHLMC). Inv Grade Corporates are represented by the Bloomberg Barclays US Corporate Investment Grade index, which measures the investment grade, fixed-rate, taxable corporate bond market.
- There is no guarantee that the Fund will make any distributions and distributions may be paid in significant part from sources that may not be available in the future and that are unrelated to the Fund’s performance, such as a return of capital.
- Reflects the current month’s cumulative distribution rate annualized. The cumulative distribution rate for the month presented represents the sum of the daily dividend distribution rate as calculated by dividing the daily dividend per share by the daily NAV per share, for each respective class, for each day in the month for which a daily dividend is declared. The distribution rate for the last twelve months is as follows for each class: I Share: 9.77%, D Share: 9.53%, T Share: 9.27%, T-I Share: 9.27%, U Share: 9.27%. The amount of the distributions that the Fund may pay, if any, is uncertain. The distribution rate shown may vary from the actual amount paid, due to whether month ends fall on business days. The Fund may pay distributions in significant part from sources that may not be available in the future and that are unrelated to the Fund’s performance, such as return of capital.
- ITD returns for the Morningstar LSTA US Leveraged Loan Index are based on the inception date of the respective share class.
- All data as of March 31, 2024 unless otherwise noted.